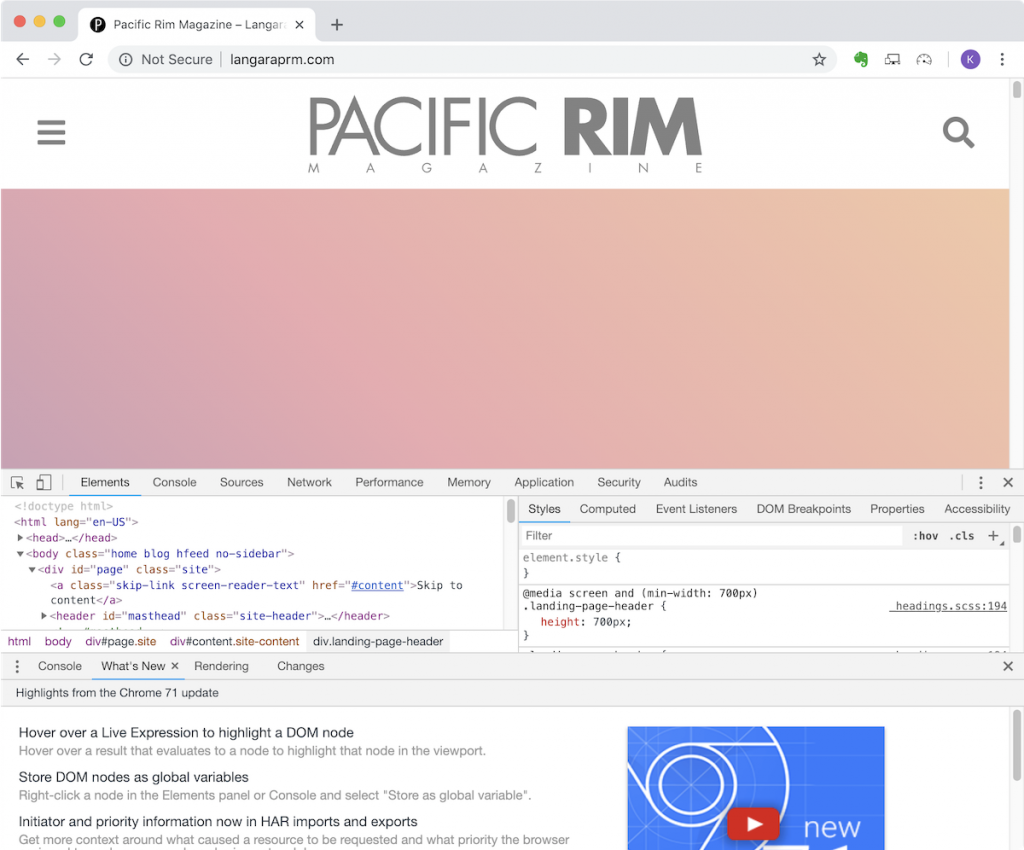
This exercise is meant to help you familiarize yourself with the Chrome Developer Tools by examining and modifying the code that makes up any webpage.
The Developer Tools allow us to do things like the following:
- see what html goes into any element in the page
- examine the nesting of html elements
- see what css is in effect on elements
- see what css is being inherited by elements
- see what css is being overridden or rejected because of syntax errors
- test the performance of javascript, animation, page load, etc
- test the page performance at various simulated network speeds
- audit accessibility features of our site
- and much more
We most typically use the DevTools to troubleshoot our own work. For this exercise, however, we will use LangaraPRM.com, a website developed each year by students in the Publishing department.
To begin, right click (control-click on Mac) on anything in the page and choose Inspect Element.
This will open up the DevTools:
If you have room on your screen, separate the DevTools from the rest of the browser window. You can do this by clicking on the vertical ellipsis (three dots) in top right of the DevTools area.
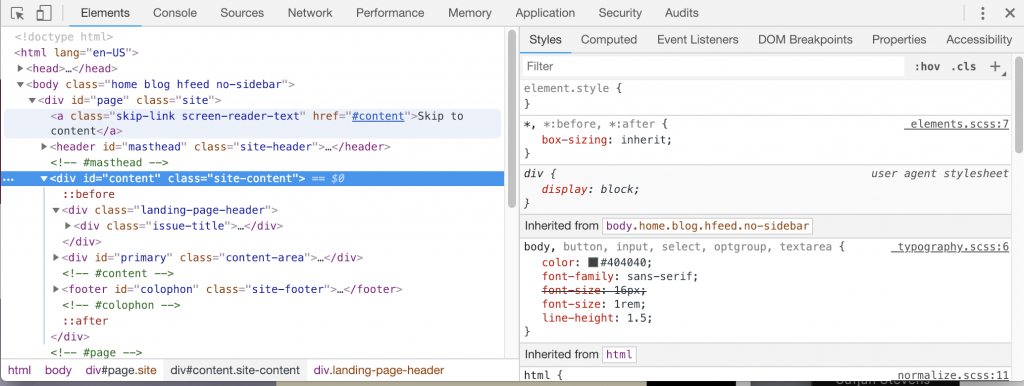
To save some space, let’s close the bottom panel in the Inspector: click on the X on the right side about half way down the Inspector area. The Inspector should now look like this:
As long as you’re in the ELEMENT section, you will see HTML on the left and CSS on the right.
In the HTML pane, click on any triangle to see nested elements.
If you click on any HTML element on the left, the CSS in effect for the element will be displayed on the right.
For example, navigate to and click on the DIV with a class of landing-page-header:
(Another way to quickly navigate to an element: when you right-click to Inspect, make sure that you are right-clicking on or near the element you’re interested in. So if we wanted to get right to the header gradient animation code, right-clicking on that box in the page will get us there.)
As noted above, we can edit the HTML or CSS in the ELEMENTS section of the Inspector. For example, things we can do in the CSS pane include:
- disabling css declarations (with the checkbox beside each)
- changing any values
- adding css properties: go to the last property value and press tab to get a new line
Normally any changes we make in the DevTools will disappear when we reload the page. But for this exercise, we’ll want any changes we make to persist. We can set that up like this:
- Click on the SOURCES tab at the top of the Inspector
- In the top left, click on the “>>” button and choose OVERRIDES.
- Click on SELECT FOLDER FOR OVERRIDES
- When prompted make a new folder on your desktop. Call it DevToolsExercise
- At the top of the browser screen, you will be prompted to allow DevTools access to that local folder. Choose ALLOW.
Now your changes will survive any page refreshes.
In this exercise, I want you to change the following:
- the font and color of the section headings.
- one of the main images in the page. Use the unsplash.it placeholder image service.
- the background color of the navigation menu visible when the menu button is clicked.
- the colors in the animation in the header area. Make the whole thing darker.
- the speed of the animation: make it 50% slower.
- one of the main images in the page. Use the unsplash.it placeholder image service.
- the font and color of the section headings.
- the color of the social media icons in the bottom of the page.
For bonus points, figure out how to change a font or two, or a font color, or a background color.
When you are done, show me your efforts.
To turn off the persistent changes feature, go back to the Sources tab in the Inspector and either turn off local overrides or delete the folder you added,.


